PBIR Implementation Guide
This guide is valid for Deneb 1.9 and above. This should work with earlier versions, but you may need to manually step through or dismiss the Create or import new specification dialog in the Advanced Editor for new visuals. This experience has been improved from 1.9 onwards.
With Power BI Enhanced Report Format (PBIR) becoming the default for Power BI reports, this page provides guidance on how you may wish to understand what is needed to make Deneb features work, if you are manually editing or programmatically generating Deneb visuals, or if you are using an LLM or other tool to help generate report content (or if you are an LLM reading this page for guidance).
In addition to PBIR, the details on this page may also help understand Deneb's internal structure better, for use with building report themes containing Deneb visuals.
The Short Version
It's advisable to read the full guide below, but if you just want the quick reference for the minimum properties needed to create a working Deneb visual in PBIR, here they are:
Minimal Deneb Visual Definition
In a visual.json file for a visual instance:
| Path | Value |
|---|---|
visual.visualType | "deneb7E15AEF80B9E4D4F8E12924291ECE89A" |
visual.objects.vega[0].properties.jsonSpec | Your stringified Vega/Vega-Lite spec, surrounded by '' |
visual.objects.vega[0].properties.jsonConfig | "'{}'" |
Validating Your PBIR Configuration
Before loading your report:
- Ensure all JSON strings are properly escaped.
- Verify integer values end with
Dsuffix. - Confirm text values are wrapped in single quotes within the
Valuefield. - Confirm boolean values are set to
trueorfalseas literals.
Refer to the Property Implementation Guide section below for more details on these types.
Visual GUID
All Power BI visuals have a unique identifier (GUID) that identifies the visual type. For the AppSource (certified) version of Deneb, this GUID is:
deneb7E15AEF80B9E4D4F8E12924291ECE89A
The GUID is also used by Power BI to determine where to look for visual updates. If the GUID Matches a published visual in AppSource, Power BI will attempt to update the visual when a new version is available. Also, if using PBIR/PBIP, this ensures that the visual code does not need to be included in the PBIP assets, as Power BI can retrieve it from AppSource directly and therefore does not need to be source-controlled.
Other Visual Editions
If you're using the other editions of Deneb, the GUIDs are as follows:
- Standalone:
STANDALONEdeneb7E15AEF80B9E4D4F8E12924291ECE89A - Alpha Channel:
ALPHAdeneb7E15AEF80B9E4D4F8E12924291ECE89A - Beta Channel:
BETAdeneb7E15AEF80B9E4D4F8E12924291ECE89A
These editions are not tied to AppSource and will require additional setup, as the .pbiviz code must be included in the PBIP assets for them to work correctly.
Much like the legacy .pbix format for Power BI workbooks, .pbiviz files are compressed folders that can be opened with a tool like 7-Zip to extract the contents for inspection. Extracting the .pbiviz file into /CustomVisuals/{GUID}/ provides the necessary structure to include the visual in PBIR/PBIP.
Understanding Visual Capabilities
Visual capabilities are special metadata that are effectively a visual's "contract" with Power BI, including what data roles it supports (and how it gets organized), formatting options, and interactivity features. In PBIR, these capabilities are defined in a JSON format and are one of the first touchpoints Power BI uses when a visual is added to a report to determine how it should integrate with the report environment.
When you add a visual to a report and start configuring it, information persisted in the JSON for that visual instance will include items that tie to this capabilities definition, allowing the visual to be regenerated from persisted state whenever you reopen the page (or report).
It can be easy to assume that these work in a particular way, but it is important to realize that (particularly in the case of persisted properties), visuals often have internal logic that acts on these values as part of their operation. So, it can therefore be assumed how they work, but this document serves to provide you with details of what properties are set and how they affect your generated Deneb visuals so that you can understand how to work with them rather than guess at what they do (and possibly do the wrong things in some cases).
Dissecting the Simplest Scenario: a Manually Added Deneb Visual
To get an understanding of the structure, let's look at what happens when we add a Deneb visual to a report canvas, without adding data or configuring anything. The base definition may look like this:
{
  "$schema": "https://developer.microsoft.com/json-schemas/fabric/item/report/definition/visualContainer/2.4.0/schema.json",
  "name": "2c2722561a0b6c3deded",
  "position": {
    "x": 80,
    "y": 56,
    "z": 0,
    "height": 280,
    "width": 280,
    "tabOrder": 0
  },
  "visual": {
    "visualType": "deneb7E15AEF80B9E4D4F8E12924291ECE89A",
    "objects": {
      "stateManagement": [
        {
          "properties": {
            "viewportHeight": {
              "expr": {
                "Literal": {
                  "Value": "270D"
                }
              }
            },
            "viewportWidth": {
              "expr": {
                "Literal": {
                  "Value": "270D"
                }
              }
            }
          }
        }
      ]
    },
    "drillFilterOtherVisuals": true
  }
}
The visual.objects section is where Deneb persists its configuration settings.
We can already see that there is information under visual.objects.stateManagement. These are internal settings that Deneb generates every time the visual receives updated information from Power BI, such as when the visual is resized or data changes, and is needed to ensure that when we open the editor, the visual preview matches the dimensions of the visual in the report. It is therefore not something you need to set manually, as Deneb will manage this for you (refer to the properties reference section below for more details).
Equivalent Minimal Definition
Therefore, if you were to add your own visual to the report using PBIR, the example below is functionally equivalent to the above:
{
  "$schema": "https://developer.microsoft.com/json-schemas/fabric/item/report/definition/visualContainer/2.4.0/schema.json",
  "name": "2c2722561a0b6c3deded",
  "position": {
    "x": 80,
    "y": 56,
    "z": 0,
    "height": 280,
    "width": 280,
    "tabOrder": 0
  },
  "visual": {
    "visualType": "deneb7E15AEF80B9E4D4F8E12924291ECE89A",
    "drillFilterOtherVisuals": true
  }
}
This will display a Deneb visual on the report canvas and will show the landing page, as there is no active project.
Adding Data to the Visual
So now, I want to add some data to my visual. In this case, I am going to add a simple table with the Product column from my Product Table, and the $ Sales measure from my Financials Table. After adding these fields to the visual, the definition now looks like this:
{
  "$schema": "https://developer.microsoft.com/json-schemas/fabric/item/report/definition/visualContainer/2.4.0/schema.json",
  "name": "2c2722561a0b6c3deded",
  "position": {
    /* same as previous example */
  },
  "visual": {
    "visualType": "deneb7E15AEF80B9E4D4F8E12924291ECE89A",
    "query": {
      "queryState": {
        "dataset": {
          "projections": [
            {
              "field": {
                "Column": {
                  "Expression": {
                    "SourceRef": {
                      "Entity": "Product"
                    }
                  },
                  "Property": "Product"
                }
              },
              "queryRef": "Product.Product",
              "nativeQueryRef": "Product"
            },
            {
              "field": {
                "Measure": {
                  "Expression": {
                    "SourceRef": {
                      "Entity": "Financials"
                    }
                  },
                  "Property": "$ Sales"
                }
              },
              "queryRef": "Financials.$ Sales",
              "nativeQueryRef": "$ Sales"
            }
          ]
        }
      },
      "sortDefinition": {
        "sort": [
          {
            "field": {
              "Column": {
                "Expression": {
                  "SourceRef": {
                    "Entity": "Product"
                  }
                },
                "Property": "Product"
              }
            },
            "direction": "Ascending"
          }
        ],
        "isDefaultSort": true
      }
    },
    "drillFilterOtherVisuals": true
  }
}
This is standard stuff for any visual under PBIR, so let's choose to focus on the bits that are important for Deneb.
-
visual.query.queryState.datasetrepresents any columns or measures added to the visual's Values data role. This is known internally in the visual capabilities asdataset, which matches how Deneb maps and assigns this data in your specification. -
Fields in the
datasetare created and referenced to the display name of the field in the well. If you don't rename this, it will match the column or measure name as defined in the data model. Otherwise, there will be adisplayNameproperty present in the metadata for the field. For example, if I rename$ SalestoTotal Salesin the visual well, the field definition will now include this:{"field": {"Measure": {"Expression": {"SourceRef": {"Entity": "Financials"}},"Property": "$ Sales"}},"queryRef": "Financials.$ Sales","nativeQueryRef": "$ Sales", // <-- This is used if unmodified in the 'Values' well"displayName": "Total Sales" // <-- This will be used by Deneb when building the dataset, if present} -
In addition to the above consideration, Deneb will also sanitize field names if they include characters that are not valid in Vega or Vega-Lite specifications. While this is not important for this step, it is important when building a specification that references these fields, so please refer to the linked documentation for more details.
Creating a Bare Minimum Specification
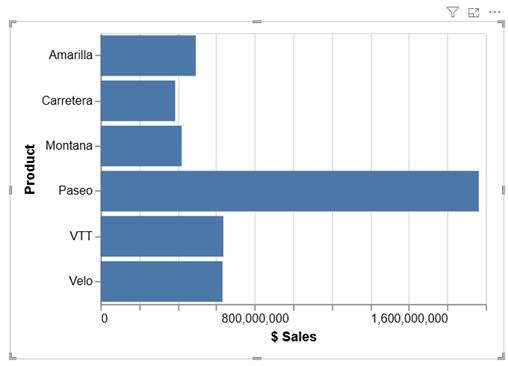
Let's say I have this simple specification that creates a simple bar chart with Vega-Lite:
{
  "data": {
    "name": "dataset"
  },
  "mark": {
    "type": "bar"
  },
  "encoding": {
    "y": {
      "field": "Product",
      "type": "nominal"
    },
    "x": {
      "field": "$ Sales",
      "type": "quantitative"
    }
  }
}
Because Power BI's property system works this way, the JSON for the specification and configuration will be serialized and escaped ("stringified") before being stored in the visual's properties. As our visual has an empty config ({}), the property storage should be prepared as follows:
{
  "$schema": "https://developer.microsoft.com/json-schemas/fabric/item/report/definition/visualContainer/2.4.0/schema.json",
  "name": "2c2722561a0b6c3deded",
  "position": {
    /* same as previous example */
  },
  "visual": {
    "visualType": "deneb7E15AEF80B9E4D4F8E12924291ECE89A",
    "query": {
      /* same as previous example */
    },
    "objects": {
      "vega": [
        {
          "properties": {
            "jsonSpec": {
              "expr": {
                "Literal": {
                  "Value": "'{\n  \"data\": {\n    \"name\": \"dataset\"\n  },\n  \"mark\": {\n    \"type\": \"bar\"\n  },\n  \"encoding\": {\n    \"y\": {\n      \"field\": \"Product\",\n      \"type\": \"nominal\"\n    },\n    \"x\": {\n      \"field\": \"$ Sales\",\n      \"type\": \"quantitative\"\n    }\n  }\n}'"
                }
              }
            },
            "jsonConfig": {
              "expr": {
                "Literal": {
                  "Value": "'{}'"
                }
              }
            }
          }
        }
      ]
    },
    "drillFilterOtherVisuals": true
  }
}
Our specification and configuration are now stored under visual.objects.vega in the properties jsonSpec and jsonConfig respectively. These will be deserialized and parsed by Deneb when the visual is loaded in Power BI, and the visual will render as expected. So as long as your JSON string is valid (and it can contain comments, as Deneb will parse it using JSONC), Deneb will be able to work with it.
Deneb's default provider configuration is Vega-Lite, so we only need to provide the specification itself, and the logic will work as expected. We will provide a reference for each objects section further below, to help you understand how to assemble more complex configurations based on your needs.
If we open our workbook with this configuration, we will see our simple bar chart rendered as expected:
Properties Reference
The following sections provide a reference for each of the objects that Deneb uses to persist configuration and state. Where possible, we'll provide as much detail as we can about what each property does and how it affects the visual's operation.
Some of these properties are used for advanced editor configuration and therefore may not be relevant if you are only generating visuals for consumption, but may help with creating report themes and understanding what setting their defaults may do for you and your users.
objects.vega
Properties in this group are concerned with the specification and configuration for the Vega or Vega-Lite runtime within a Deneb visual instance.
| Property | Default Value (if Omitted) | Type | Remarks |
|---|---|---|---|
jsonSpec | '{}' | text | The Vega or Vega-Lite specification, which is JSON (or JSONC) turned into a string representation. |
jsonConfig | '{}' | text | The Deneb configuration object, which is JSON (or JSONC) turned into a string representation. |
provider | 'vegaLite' | text (enum) | The provider to use when parsing a specification. Either vega or vegaLite. |
renderMode | 'svg' | text (enum) | The rendering mode to use. Either canvas or svg. |
logLevel | 3D (vega.Info) | integer | The logging verbosity level for the Vega/Vega-Lite runtime. One of: 0 (None), 1 (Error), 2 (Warn), 3 (Info). |
enableTooltips | true | boolean | Enables the Power BI tooltip handler instead of Vega's built in one. Analogous to checking the Tooltip handler checkbox in the interactivity settings. |
enableContextMenu | true | boolean | Controls whether the Power BI context menu appears on right-click. Analogous to checking the Show context menu on right-click checkbox in the interactivity settings. |
enableContextMenuSelector | true | boolean | When the context menu is enabled, controls whether Deneb attempts to resolve the clicked data point for drill-through and other data-specific menu options. Analogous to checking the Attempt to resolve data point-specific actions checkbox in the interactivity settings. Only relevant when enableContextMenu is true. |
enableHighlight | false | boolean | Enables support for tracking and responding to highlight events from other visuals. Analogous to checking the Expose cross-highlight values for measures checkbox in the interactivity settings. |
enableSelection | false | boolean | Enables support for tracking and responding to cross-filter events when interacting with your visual and tracking state. Analogous to checking the Expose cross-filtering values for dataset rows checkbox in the interactivity settings. |
selectionMaxDataPoints | 50D | integer | The maximum number of data points to consolidate for cross-filtering operations, and is only relevant when enableSelection is true. |
selectionMode | simple | text (enum) | The selection mode to use when enableSelection is true. simple will monitor the Vega view, attempt to resolve data points and apply cross-filtering. advanced relies upon advanced cross filtering, which is only supported and functional when provider is 'vega' and you have defined the relevant events in your spec to initiate it. |
version | [managed by Deneb] | text | Deneb uses this as a checkpoint to store the version of the provider last used to render your visual, and is assumed to be the currently packaged version of Vega or Vega-Lite if omitted. It is automatically populated when the visual is updated and used to track any migration requirements. |
objects.display
Properties in this group are displayed in the Rendered visual property menu in the formatting pane and are concerned with any processing Deneb does to the visual output on top of the Vega view.
| Property | Default Value (if Omitted) | Type | Remarks |
|---|---|---|---|
scrollbarColor | #000000 | color | The color of the container scrollbar when it is shown. |
scrollbarOpacity | 20D | integer | The opacity of the container scrollbar when it is shown. Values are converted to decimal percentage by Deneb, and valid values are 0D to 100D. |
scrollbarRadius | 0D | integer | The border radius of the container scrollbar in px when it is shown. Valid values are 0D to 8D. |
scrollbarWidth | 10D | integer | The width of the container scrollbar in px when it is shown. Valid values are 8D upwards; values below 8D are not usable for interactive handles. |
scrollEventThrottle | 5D | integer | The throttle delay in ms for updating the container scroll position values in the denebContainer signal. Valid values are 0D to 1000D. |
objects.dataLimit
Properties in this group are displayed in the Data management menu and determine how Deneb handles data row limits imposed by Power BI, as well as continuous view settings.
| Property | Default Value (if Omitted) | Type | Remarks |
|---|---|---|---|
override | false | boolean | When true, this will enable the Override row limit property, instructing Deneb to fetch more data when the standard 10,000 row limit is reached. |
showCustomVisualNotes | true | boolean | When true, this will show the Custom visual notes section in the editor's data panel when data is being fetched. |
enableIncrementalDataUpdates | false | boolean | When true, enables the continuous view feature, patching dataset updates into the existing Vega view rather than recompiling the specification. Only applies when the updated dataset is within the configured incrementalUpdateThreshold and the spec is eligible. |
incrementalUpdateThreshold | 500D | integer | The maximum row count at which dataset updates will be patched rather than trigger a full recompile. Valid values are 5D to 5000D; the 5000D ceiling is a hard limit imposed by Deneb (the main thread cannot safely support patching above this). Only applies when enableIncrementalDataUpdates is true. |
objects.developer
Properties in this group are intended for internal use.
| Property | Default Value (if Omitted) | Type | Remarks |
|---|---|---|---|
version | [managed by Deneb] | text | Deneb uses this as a checkpoint to store the version of the visual last used in your report, and is assumed to be the current visual version from the manifest if omitted. It is automatically populated when the visual is updated and used to track any migration requirements when a newer version of the visual is applied to the report (or warnings if downgraded). |
objects.stateManagement
Properties in this group are intended for internal use and transient state management between sessions.
| Property | Default Value (if Omitted) | Type | Remarks |
|---|---|---|---|
viewportHeight | null [managed by Deneb] | integer | The last known height of the visual viewport when viewing normally (in px). If omitted, Deneb will calculate this and update it whenever the visual is updated, ensuring it matches the visual container on the canvas. It is only needed to ensure that the preview is correctly sized in the Advanced Editor and is not necessary for any automation. Details have only been included for completeness. |
viewportWidth | null [managed by Deneb] | integer | The last known width of the visual viewport when viewing normally (in px). If omitted, Deneb will calculate this and update it whenever the visual is updated, ensuring it matches the visual container on the canvas. It is only needed to ensure that the preview is correctly sized in the Advanced Editor and is not necessary for any automation. Details have only been included for completeness. |
denebMetaVersion | "" [managed by Deneb] | text | Records the version of Deneb's internal metadata schema that was in effect when the project was last saved, so that migrations can be applied when the project is opened in a newer version of the visual. Managed automatically by Deneb and not necessary for any automation; details have only been included for completeness. |
scaleToZoom | false | boolean | When true, the canvas renderer scales its resolution to match the current report zoom level (multiplied by the editor preview zoom, when viewing in the Advanced Editor) to reduce blurriness at non-100% zoom. Only applies when the Canvas renderer is selected; has no effect under SVG. Refer to the Settings Pane for more details. |
supportFieldConfiguration | "" | supportFieldConfiguration (text) | JSON-serialized map of per-field supporting field flags (e.g. whether __highlight, __format, __names, etc. should be generated for each column or measure). Managed automatically by Deneb as you adjust the Supporting Fields: dataset section of the Project setup pane, and stored here for session persistence. |
consolidateFieldParameters | false | boolean | When true, Deneb consolidates Power BI field parameter components into a single array-valued column named after the parameter. New projects initialize this to true; projects migrated from pre-2.0 Deneb are left at false for compatibility with existing community workarounds. |
objects.editor
Properties in this group are displayed in the Advanced Editor property menu in the formatting pane and concern the editor's operation and appearance. Setting them can be used to 'prime' the editor experience for users, but will have no effect on the visual rendering or operation outside of the editor.
| Property | Default Value (if Omitted) | Type | Remarks |
|---|---|---|---|
theme | light | text (enum) | The theme to use for the editor interface. Either light or dark. |
showViewportMarker | true | boolean | When true, shows the viewport marker in the editor preview area. |
previewScrollbars | true | boolean | When true, shows scrollbars in the editor preview area when the rendered specification overflows the container viewport. |
backgroundPassthrough | true | boolean | When true, the editor preview area will render with a transparent background, allowing you to see through to any underlying report canvas background. |
position | left | text (enum) | The position of the JSON editor pane. Either left or right. |
fontSize | 10D | integer | The font size in px for the JSON editor. Valid values are 8D to 30D. |
wordWrap | true | boolean | When true, enables word wrapping in the JSON editor. |
showLineNumbers | true | boolean | When true, shows line numbers in the JSON editor. |
debouncePeriod | 300D | integer | How frequently to track changes to the content inside the JSON editor. |
debugTableRowsPerPage | 50D | integer | The number of rows to show per page for the Advanced Editor's data tables in the debug pane. This can be any integer value, but the interface provides options for 10, 25, 50, 100, 150, and 200. |
Property Implementation Guide
The PBIR documentation does not elaborate on property specifics very well, so here are some notes on the types that may help you understand how to work with them in Deneb. Note that we only cover how we support them, not the entire PBIR property system.
Common Pitfalls
- Forgetting the
Dsuffix on numeric values - Power BI will fail to parse - Double-escaping JSON in
jsonSpec- results in parse errors - Using double quotes instead of single quotes for text literals
- Missing
expr.Literal.Valuewrapper - properties won't be recognized
boolean
Boolean properties should use true or false literals. For example, to set a boolean property to true, you would use:
{
  "enableTooltips": {
    "expr": {
      "Literal": {
        "Value": "true"
      }
    }
  }
}
color
Color properties match the structure of #/definitions/fill from the Report Theme JSON Schema published by MS. For Deneb, we currently only use (and support) solid.
Colors can be supplied as Literal values that support any known HTML/CSS color format, but the syntax is slightly different from that of regular text properties. It is also worth noting that the color value should be enclosed in single quotes because it is stored as a text literal within the JSON structure. For example, to set a color property to red, you would use:
{
  "scrollbarColor": {
    "solid": {
      "color": {
        "expr": {
          "Literal": {
            "Value": "'#FF0000'" // or "'red'", "'rgb(255,0,0)'", etc.
          }
        }
      }
    }
  }
}
And you can use ThemeDataValue for binding to your theme:
{
  "scrollbarColor": {
    "solid": {
      "color": {
        "expr": {
          "ThemeDataColor": {
            "ColorId": 1,
            "Percent": 0
          }
        }
      }
    }
  }
}
integer
Integer values should be suffixed with a D to indicate that they are numeric literals. For example, to set an integer property to 50, you would use:
{
  "selectionMaxDataPoints": {
    "expr": {
      "Literal": {
        "Value": "50D"
      }
    }
  }
}
text
Text properties should be enclosed in single quotes (') to indicate that they are string literals. For example, to set a text property to vegaLite, you would use:
{
  "provider": {
    "expr": {
      "Literal": {
        "Value": "'vegaLite'"
      }
    }
  }
}
Any JSON objects or arrays that need to be stored as text (such as the Vega specification) should be stringified and escaped accordingly, as shown in the earlier examples.
supportFieldConfiguration
The supportFieldConfiguration property on objects.stateManagement is stored as a text property, but its content is a JSON-serialized map of per-field supporting-field flags. Deneb manages it automatically when you adjust the Supporting Fields: dataset section of the Project setup pane; the structure is documented here for programmatic authoring or template tooling.
Within the serialized JSON:
- Top-level keys are the display names of the columns and measures in the visual's Values data role.
- Values are objects describing the flag state for that field.
- The map is sparse at the field level - an entry is only included for fields whose configuration differs from Deneb's role-based defaults. Fields without an entry inherit those defaults on load (see the Supporting Fields reference for the role-based defaults).
- When an entry is present, all five of the base flags -
highlight,highlightStatus,highlightComparator,format,formatted- must be specified as explicittrueorfalsevalues. The two parameter-specific flags (names,treatAsParameter) are optional and typically only appear for fields flagged as field parameters.
For example, to enable the Format string supporting field on a [Product] column and the Highlight value supporting field on a [$ Sales] measure:
{
  "supportFieldConfiguration": {
    "expr": {
      "Literal": {
        "Value": "'{\"Product\":{\"highlight\":false,\"highlightStatus\":false,\"highlightComparator\":false,\"format\":true,\"formatted\":false},\"$ Sales\":{\"highlight\":true,\"highlightStatus\":false,\"highlightComparator\":false,\"format\":false,\"formatted\":false}}'"
      }
    }
  }
}
Note the outer single quotes wrapping the JSON string and the inner double-quote escaping - this is the standard PBIR pattern for text literals containing structured content.
The same flag shape is used inside templates, but with two differences: it is embedded inline within each datasets[<name>][] field entry (so there is no outer map keyed by display name), and it does not require the PBIR text-literal wrapping - the flag object appears as a regular nested JSON object.